-
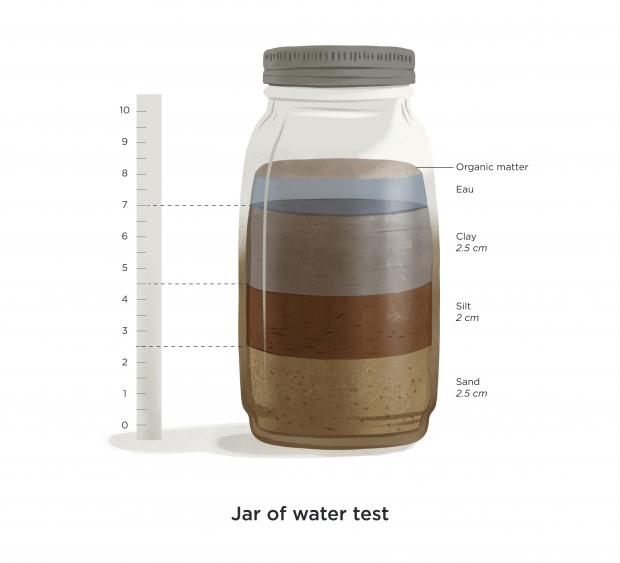
simple tests
-
ph
-
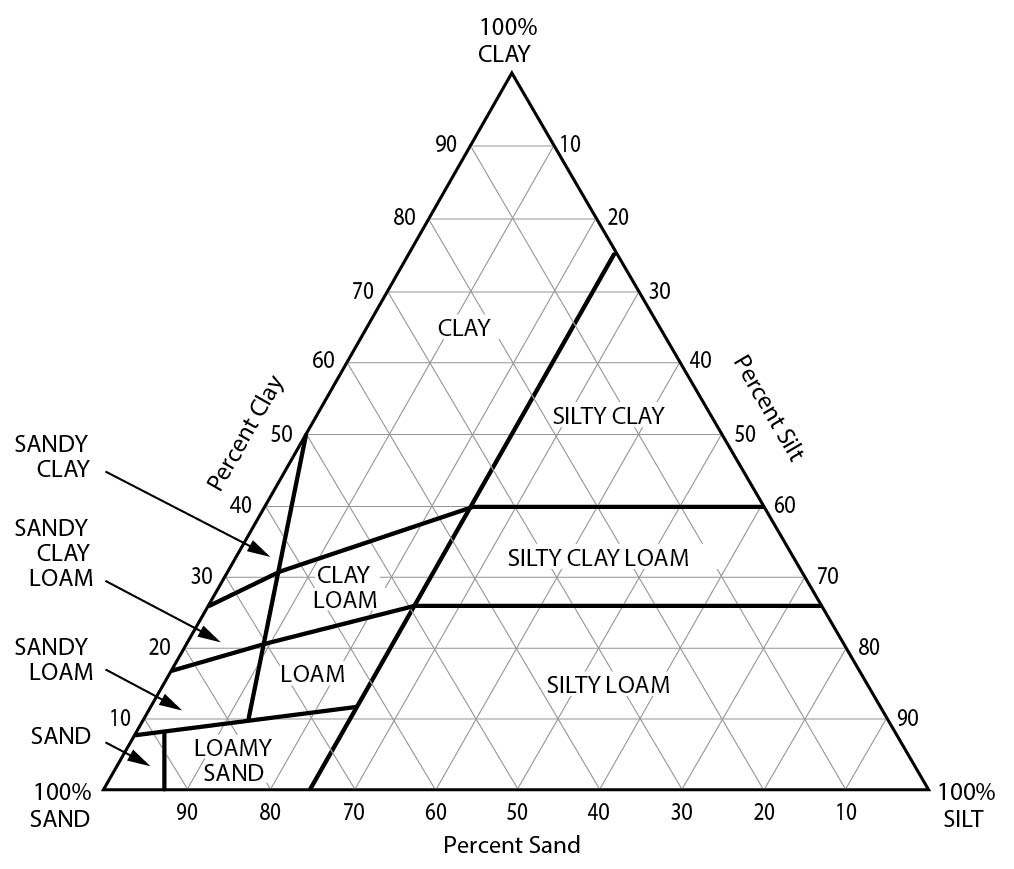
type
- sand
- silt
- clay
- Soil Laboratory Test Sieve for Particle Analysis
-
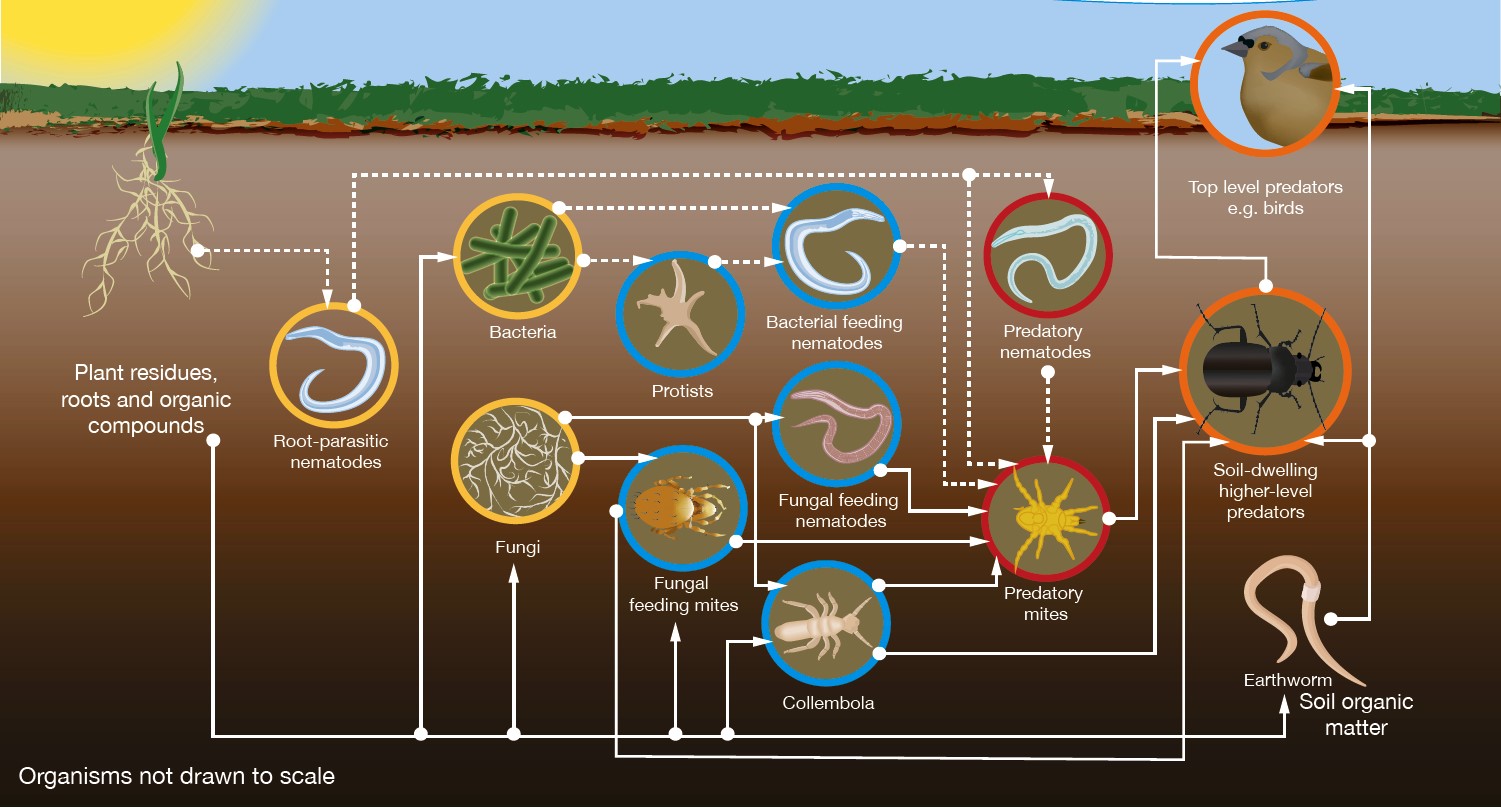
worms
-
Property sand silt clay particle size 0.05 mm to 2 mm 0.002 mm to 0.05 mm Less than 0.002 mm texture Grainy Silky/Floury Sticky when wet water drainage High Moderate Poor nutrient retention Low Moderate High aeration High Moderate Poor compaction Low Moderate High thermal conductivity High Moderate Low heat capacity Low Moderate High ph level Slightly Acidic to Neutral Neutral to Slightly Alkaline Usually Alkaline organic Matter Content Low Moderate High bulk density Low Moderate High porosity High Moderate Low cation exchange capacity Low Moderate High electrical conductivity Low Moderate High soil structure Loose Stable Dense infiltration rate High Moderate Low erodibility High Moderate Low permeability High Moderate Low soil color Light Variable Dark -
water drainage:
-
nutrient retention: the capacity of the soil to hold nutrients. clay has high nutrient retention, while sand has low.
-
aeration: the movement of air through the soil. sandy soils are well-aerated, clay soils are not.
-
compaction: the tendency of the soil to compact under pressure. clay is prone to compaction, while sand is not.
-
thermal conductivity: how well the soil conducts heat. sandy soils have high thermal conductivity, clay soils have low.
-
heat capacity: the amount of heat the soil can hold. clay has a high heat capacity, sand has a low.
-
ph level: the measure of acidity or alkalinity of the soil. sand tends to be slightly acidic, clay is often alkaline.
-
organic matter content: the amount of decomposed plant and animal material in the soil. clay soils generally have more organic matter.
-
bulk density: the mass of soil per unit volume. clay has a high bulk density, sand has a low.
-
porosity: the volume of pore space in the soil. sand is more porous than clay.
-
-
-
electrical conductivity: the soil’s ability to conduct electrical current, often related to its salinity. clay tends to have higher electrical conductivity.
-
soil structure: the arrangement of soil particles into aggregates. sandy soils are loose, clay soils are dense.
-
infiltration rate: the rate at which water enters the soil. it’s high in sandy soils and low in clay soils.
-
erodibility: the susceptibility of soil to erosion. sandy soils are more easily eroded than clay soils.
-
permeability: the ability of soil to transmit water and air. high in sandy soils, low in clay soils.
-
soil color: the color of the soil, which can indicate organic matter content and mineral composition. sandy soils are often lighter, clay soils darker.
-

-
nutrients for plants
- pond
- water
- soil from bottom
- mulch from plants
- trees
- leaves
- mulch
- animals ⇒ micronutrients
- manure
- bones, carcasses and innards
- composted
- buried under new fruit trees
- legumes ⇒ nitrogen
- wood ash ⇒ potassium
- rock dust
- human urine
- pond
-
fertiliser
-
compost
-
worm farm
-
As the user selects a soil texture, they will realize each texture has a unique colour. The idea behind this stems from both the colour triangle and the soil texture triangle. Such that 100% sand is yellow, 100% silt is cyan, and 100% clay is magenta. By giving each texture class a percent sand silt and clay value which adds to 100, we can retrieve a unique colour for each class.
-
-
soil fertility assessment
- physical characteristics of the soil
- texture and water content
- predominantly sandy, classified as loamy sand, sandy clay loam, and sandy loam.
- low water-holding capacity, with low water content at both field capacity and the permanent wilting point.
- ph and electric conductivity
- ph levels range from slightly acidic to neutral.
- very low electric conductivity, indicating low availability of soluble salts.
- nutrient content and soil health
- organic carbon and nutrients
- high percentage of organic carbon (5.46% at coffee site), indicating fertile soil.
- medium to low levels of nitrogen, phosphorus, and potassium.
- micro-nutrients and heavy metals
- high quantities of aluminum, calcium, and iron, possibly from natural or anthropogenic sources.
- presence of heavy metals like lead and mercury suggests contamination from human activities.
- texture and water content
- physical characteristics of the soil
-
laboratory test result
-
parameter coffee site sen wood site edem site interpretation c-organic (%) 5.46 5.00 3.79 low to medium total nitrogen (n) (%) 0.45 0.36 0.35 medium available phosphorus (p) (ppm) 10.85 8.91 10.12 low to very low available potassium (k) (ppm) 177.83 167.7 188.67 medium water content - permanent wilting point (%) 7.84 7.02 8.06 low water content - field capacity (%) 33.37 34.84 32.16 medium texture - sand (%) 78.56 74.06 80.38 loamy sand to sandy loam texture - silt (%) 8.22 2.7 4.74 texture - clay (%) 13.22 23.25 14.89 ph 6.39 6.59 6.95 slightly acidic to neutral electric conductivity (mmhos/cm) 0.36 0.34 0.21 very low -
recommendations
- incorporating organic matter like mature compost can improve soil structure and nutrient retention.
- planting nitrogen-fixing crops will help replenish soil nitrogen levels naturally.
- regular soil testing is recommended to monitor nutrient levels and prevent contamination.
-
conclusion
- proper management practices can enhance soil productivity in cyber valley, supporting diverse agricultural activities while preserving environmental health.
-
raw results
-
Aspect No Parameters Leaves of D. longifolia Stem of D. longifolia Fruit of D. longifolia Soil of Coffee Site Soil of Sen Wood Site Soil of Edem Site Heavy Metals (Micro-nutrient) 1 Lead (Pb) (ppm) 29.318 29.328 29.032 28.365 31.165 30.454 2 Copper (Cu) (ppm) 1.195 0.774 0.921 16.505 16.953 20.236 3 Magnesium (Mg) (ppm) 559.674 102.226 215.281 1,176.15 nd 1,177.06 4 Manganese (Mn) (ppm) 3.072 0.234 0.059 171.053 173.547 196.925 5 Iron (Fe) (ppm) 30.662 35.043 6.801 8,498.41 5,452.49 10,409.33 6 Cadmium (Cd) (ppm) nd nd nd nd nd nd 7 Zinc (Zn) (ppm) nd nd nd 15.925 15.45 16.551 8 Potassium (K) (ppm) 152.795 812.001 276.012 293.825 3,436.448 2,183.664 9 Chromium (Cr) (ppm) 0.593 0.964 0.934 1.041 1.084 0.855 10 Calcium (Ca) (ppm) 28,026.58 3,134.28 10,374.29 29,250.81 7,754.06 4,355.66 11 Silicon (Si) (ppm) nd nd nd nd nd nd 12 Aluminium (Al) (ppm) 291.649 216.61 32.905 47,322.424 22,761.721 18,469.499 13 Arsenic (As) (ppm) nd nd nd nd nd nd 14 Mercury (Hg) (ppm) 4.158 nd nd 13.307 nd 7.107 Phyto-chemical metabolic property 15 Antioxidant (mg/100mL) not performed not performed 21.284 not performed not performed not performed 16 Flavanoid (mg/100mL) not performed not performed 18.495 not performed not performed not performed 17 Phenol (mg/100mL) not performed not performed 103.297 not performed not performed not performed 18 Tannin (mg/100mL) not performed not performed 77,835.29 not performed not performed not performed 19 Anthocyanin (mg/100g) not performed not performed 1.529 not performed not performed not performed 20 Vitamin C (mg/100g) not performed not performed 96.381 not performed not performed not performed 21 Vitamin A (mg/100g) not performed not performed 1.78 not performed not performed not performed Essential Macro Nutrient 22 C-organic (%) not performed not performed not performed 5.46 5 3.79 23 Total Nitrogen (N) (%) not performed not performed not performed 0.45 0.36 0.35 24 Available Phosphorus (P) (ppm) not performed not performed not performed 10.85 8.91 10.12 25 Available Potassium (K) (ppm) not performed not performed not performed 177.83 167.7 188.67 Physical features 26 Water Content - Permanent Wilting Point (%) not performed not performed not performed 7.84 7.02 8.06 27 Water Content - Field Capacity (%) not performed not performed not performed 33.37 34.84 32.16 28 Texture - Sand (%) not performed not performed not performed 78.56 74.06 80.38 29 Texture - Silt (%) not performed not performed not performed 8.22 2.7 4.74 30 Texture - Clay (%) not performed not performed not performed 13.22 23.25 14.89 31 pH not performed not performed not performed 6.39 6.59 6.95 32 Electric Conductivity (mmhos/cm) not performed not performed not performed 0.36 0.34 0.21
-